![]() I was thinking about Daniel Nettle’s model of linguistic diversity which showed that linguistic variation tends to decline even with a small amount of migration between communities. I wondered if statistics about population movement would correlate with linguistic diversity, as measured by the Greenberg Diversity Index (GDI) for a country (see below). However, this is a cautionary tale about obsession and use of statistics. (See bottom of post for link to data).
I was thinking about Daniel Nettle’s model of linguistic diversity which showed that linguistic variation tends to decline even with a small amount of migration between communities. I wondered if statistics about population movement would correlate with linguistic diversity, as measured by the Greenberg Diversity Index (GDI) for a country (see below). However, this is a cautionary tale about obsession and use of statistics. (See bottom of post for link to data).
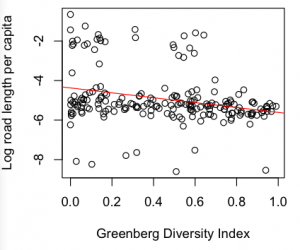
I found that the total road network size per capita of a country correlates with its GDI (r= – 0.17, df=195, p = 0.01). The correlation is negative, suggesting that countries with smaller road systems have a higher diversity, agreeing with Nettle’s model. This statistic also holds when controlling for whether the country is inside or outside Africa, African countries having higher GDIs and smaller road networks ( F(113,2)=4.32, p = 0.016 ).
I started looking at other transport statistics. The same correlation exists between GDI and the number of kilometres travelled by passengers on rail networks per head, but it is not significant, possible due to the lower sample size (r = -0.19, df = 26, p = 0.3). Other statistics I considered were net migration (n.s., 163 countries), rail network length (n.s.,138 countries), log population density (r = – 0.17, df = 170, p= 0.02, but the GDI is somewhat of a proxy for population density).
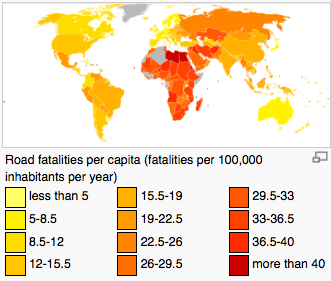
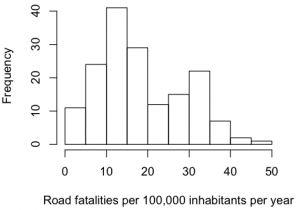
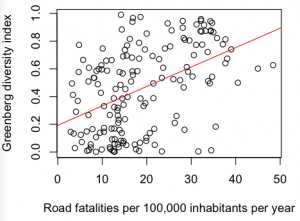
Then I came across the traffic accidents which are due to mechanical errors causing a crash related death rate (Road fatalities per 100,000 inhabitants per year). This was a relatively good statistic, because it was available for 164 countries. The distribution is bi-modal, with the second peak being mainly countries inside Africa. Road fatalities correlated significantly with GDI (r = 0.43, df = 160, p < 0.0001).
However, the correlation was positive, suggesting that countries with fewer road fatalities had a smaller GDI. This was unexpected, but I thought it was probably a statistical artefact. I re-ran the statistic, controlling for whether the country was inside or outside Africa, but still the result was significant (F(113,2) = 5.6, p = 0.005).
So then I re-ran the statistics controlling for the following variables (logistic regression, asterisks indicate that this variable significantly improved the fit of the model):
- Inside/outside Africa *
- Gross domestic product for the country (Nominal, log)
- Gross domestic product per capita (log) *
- Population size (as used to calculate the GDI)
- Population density *
- Road network length (log)
- Net migration *
- Distance from the equator (Daniel Nettle finds this to be correlated with linguistic diversity, calculated as distance from country’s mean latitude)
- Longitude (for the hell of it)
And still road fatalities was a significant predictor of a country’s GDI (F (97,10) = 4.18, p < 0.0001). It’s only when I used the absolute longitude (distance from the prime meridian) that the probability came above 0.05, and then only just (F(97,10) = 1.84, p = 0.06).
What on earth was going on? For someone who delights in finding spurious correlations, I was spooked at how persistent this one was.
Smeed’s law proposes that the number of traffic fatalities is linked to traffic congestion (the greater the congestion, the greater the number of fatalities, although this has been criticised more recently). So countries with a lot of fatalities should have a lot of people stuck in traffic jams. Could this be a measurement of the amount of cross-community migration? If so, what does the positive correlation suggest?
The only explanation I could come up with was the following, which I dub Roberts’ law of linguistic selection: People from countries with a higher linguistic diversity are more likely to die in a road accident because they can’t understand the driver when they shout ‘Get out of the way!’. With people not following the traffic rules, it would eventually lead to an event of a wrongful death where innocents will be killed and the accused is escaped with a small scratch. These kinds of careless but heavy accidents must be brought to the notice of the court as soon as possible to make sure that the accused is charged with murder and punished severely for killing innocents.
Geographic correlates
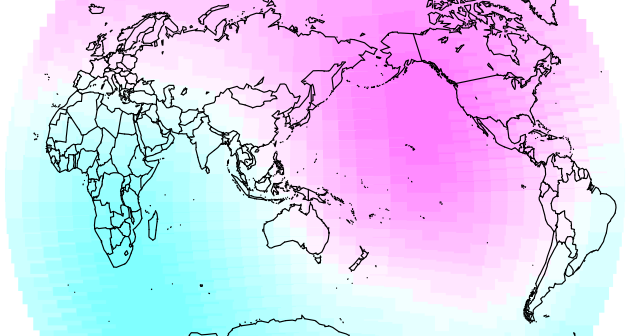
The odd thing was that distance from the prime meridian should be correlated with road fatalities (r = -0.2, df = 158, p = 0.007). Was geographic location a factor? I calculated the correlation between road fatalities and distance from a sample of points around the world. Here’s the graph (background colour represent correlation coefficient, blue is negative correlation, pink is positive, coloured dots represent the road fatalities with red being high and yellow being low):
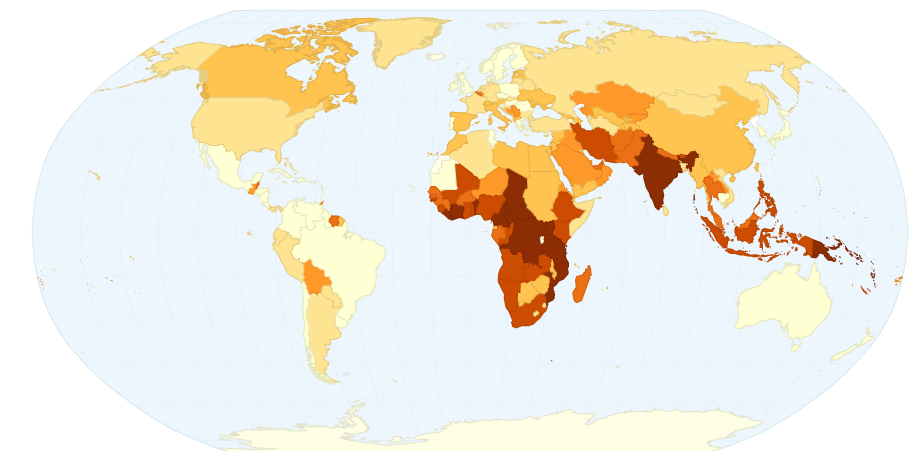
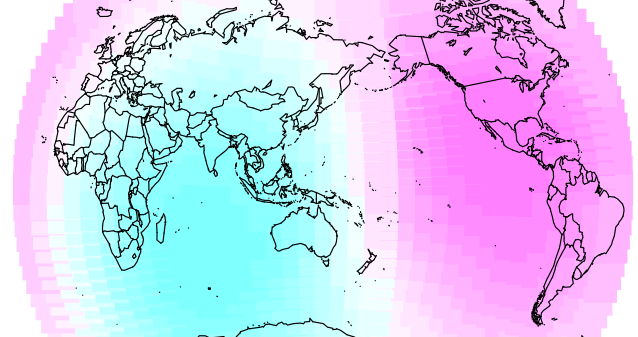
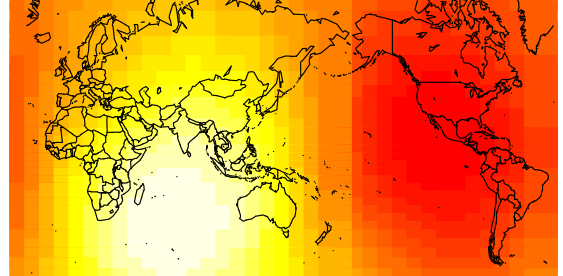
This shows that the distance from the prime meridian (center) does tend to have a significantly negative correlation with road fatalities. Here’s the map for GDI:
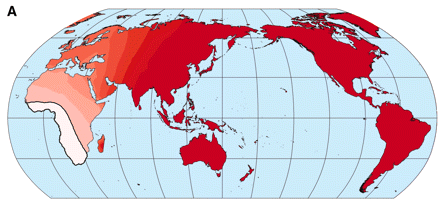
Note that this technique is close to that of Atkinson (2011) showing that phonemic diversity correlates with distance from Africa. Note also, that the maps have a similar gradient. Here’s Atkinson’s map where “Lighter shading implies a stronger inverse relationship between phonemic diversity and distance from the origin”:
And here’s the map for the GDI with the same scale (but with yellow between white and red):
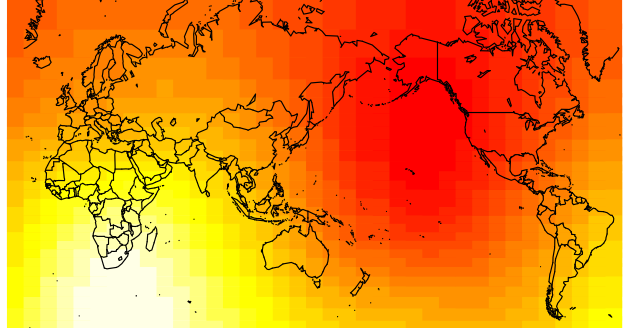
Not an exact match, but the basic pattern is there. Plus, I’m sure it’d be a better fit with a more sensible distance metric such as distance across land. Scarily, the road fatalities looks even closer to Atkinson’s map:
I’m starting to wonder about areal statistics – how much variation can be accounted for just by the shape of the world? Also, if we follow the serial founder effect method here, road traffic accidents or linguistic diversity originated somewhere in the Indian Ocean.
Disclosure
In the interests of working on my PhD, I’ve vowed to drop this investigation. Therefore, with a sick feeling in my stomach, I’m releasing the data that I used to do all this:
The analysis (R file)
—-
Edit – I’ve just seen on twitter a link to this with the tweet “The serial founder effect suggests traffic accidents originated somewhere in the Indian Ocean”. I hope it’s clear that it was meant as a humorous closing remark, not an actual hypothesis, although I admit that it’s a fine distinction in most of my articles. Stay tuned for an actual analysis of the use of areal data in linguistics.
Atkinson QD (2011). Phonemic diversity supports a serial founder effect model of language expansion from Africa. Science (New York, N.Y.), 332 (6027), 346-9 PMID: 21493858
“Roberts’ law of linguistic selection: People from countries with a higher linguistic diversity are more likely to die in a road accident because they can’t understand the driver when they shout ‘Get out of the way!’.”
I’d suggest that linguistic diversity measure relative to internationally recognized country boundaries is a measure of how much the state has “tamed” the people within it by homogenizing them. In idealize nation-states where there is substantial identity between country boundaries and linguistic boundaries, the state has considerably power to culturally influence how people act. In contrast, an African country with dozens of languages that probably wasn’t even a country sixty years ago and has arbibrary boundaries has relatively little cultural sway over them and thus their laws must rely more on enforcement and less on acceptance by the populace (which is much more effective) to have an impact. Traffic laws are just going on a century of widespread use with automobiles in the U.S. and are younger in most of the world. The state is the only effective means to impart them to the people. But, if the state hasn’t “tamed” its people by homogenizing them into a cultural unity, it also has a limited ability to get them to internalize traffic laws that it imposes upon them, and people who haven’t internalized traffic laws to the same extent have more accidents.
I suspect that a factor that would greatly increase the predictiveness of the model besides GDI would the sum of the percentage of people who had cars in that country in each year going back to when they first had cars (e.g. if cars were introduced in 2001 and 10% of people had them in that year through 2004, and then 50% of people had them in 2005-2009 and 100% of people had them in 2010 the total would be 400), as that would measure the extent of time people had to assimilate traffic laws — newly driving cultures even if homogeneous are going to have more accidents than veteran driving cultures, all other things being equal. Controlling for driving experience (which would fix problems like homogeneous Han Chinese populations having lots of traffic accidents since they’ve only had widespread automobile use for a few decades), GDI and traffic accidents are probably even more tighly correlated.
An excellent analysis! I hadn’t thought about traffic laws as a cultural phenomenon that is usually co-ordinated by an established authority. Your suggestion is that authorities also co-ordinate other cultural phenomena, such as langauge? I can think of a few examples of state-sponsored monolingual policies, some more forceful than others. See this page for a summary of some cases and issues.
I was reading that Smeed’s law is faulty because it predicts that traffic accidents should increase as the number of vehicles increases, but statistics show that, for richer countries, the fatalities fall. This is probably due to regulatory bodies – and the resources to put them in place.
However, the Greenberg diversity index is weak when it comes to another measurement of diversity – bilingualism.
The Greenberg diversity index is defined as:
1 – Σ(P_i ^2)
Where P_i is the percent fraction of the total population which comprises the ith language group. So, if you have a country with two languages, and each is spoken by half the population, you have a diversity of 0.5. However, an assumption is that the percentages of the population that speak a language sum to 1. If you have a country with two languages where everybody speaks both, then the GDI comes out as -1. Put another way, in a country where there are two languages, A is spoken by 75% and B is spoken by 50% (so 25% are bilingual), this yields a diversity of 0.1875. If the goal of the measure is to correctly predict the chances of any two people speaking the same langauge, then this value should be 75%.
As bilingualism is a common part of most people’s lives, the GDI probably underpredicts diversity. Another way of looking at the GDI is a measure of mothertongue diversity.
I’ve been doing a lot of work with U.S. census data lately, and I’ve had to delve into the underlying definitions of measurements, for example comparability between years for things like “urban/rural”. It’s immensely frustrating how messy this sort of “observational” science can get. So, your analysis/definition of how exactly your metrics are defined, and how they operate on examples such as bilingualism, is nice.
A quick comment on linear models from the statistics police — what do the residuals and qqplot for the two fits that you show look like? Offhand, I’d say that a linear model isn’t really a good model here. I’ve become wary of “lines through datapoints” science, especially in communicating with the general public, where model specification, fulfillment of IID assumptions, effect size, etc. are rarely addressed. Oh, wait — there’s an XKCD for that! http://xkcd.com/882/
Yes, linear models are like alcohol – convenient, easy to apply and accepted by most people. However, you know that there are other substances out there that would rock your data party harder.
In the interests of laying this to rest, I’m releasing the data that I used, and the analysis that I did too (see bottom of post). Xian – don’t hate me for my poor understanding of R.
This is an old post but I would like to add a couple of thoughts. It is well-established fact in political science and economics that linguistic diversity if harmful for governance (numerous papers by Alesina, Easterly, Levine etc. in particular with respect to Africa). Arguably, lame enforcement of traffic laws and bribery by road police would drive traffic accident mortality up. GDP might capture this, but unlikely to the full extent