Never mind language, emotions are in a category of their own

A new paper in the journal ‘Emotion’ has presented research which has implications for the evolution of language, emotion and for theories of linguistic relativity.

A new paper in the journal ‘Emotion’ has presented research which has implications for the evolution of language, emotion and for theories of linguistic relativity. The paper, entitled ‘Categorical Perception of Emotional Facial Expressions Does Not Require Lexical Categories’, looks at whether our perception of other people’s emotions depend on the language we speak or if it is universal. The results come from the Max Planck Institute for Psycholinguistics and Evolutionary Anthropology.

Human’s facial expressions are perceived categorically and this has lead to hypotheses that this is caused by linguistic mechanisms.

The paper presents a study which compared German speakers to native speakers of Yucatec Maya, which is a language which has no labels which distinguish disgust from anger. This was backed up by a free naming task in which speakers of German, but not Yucatec Maya, made lexical distinctions between disgust and anger.

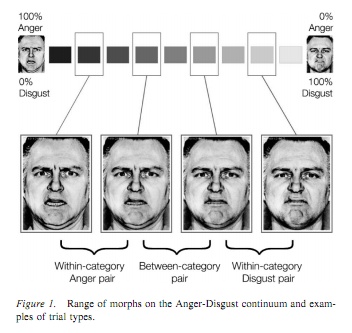
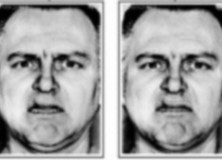
The study comprised of a match-to-sample task of facial expressions, and both speakers of German and Yucatec Maya perceived emotional facial expressions of disgust and anger, and other emotions, categorically. This effect was shown to be just as significant across the language groups, as well as across emotion continua (see figure 1.) regardless of lexical distinctions.

The results show that the perception of emotional signals is not the result of linguistic mechanisms  which create different lexical labels but instead shows evidence that emotions are subject to their own biologically evolved mechanisms. Sorry Whorfians!

References

Sauter DA, Leguen O, & Haun DB (2011). Categorical perception of emotional facial expressions does not require lexical categories. Emotion (Washington, D.C.) PMID: 22004379

Linguistic diversity and traffic accidents

This post was chosen as an Editor's Selection for ResearchBlogging.orgI was thinking about Daniel Nettle’s model of linguistic diversity which showed that linguistic variation tends to decline even with a small amount of migration between communities.  I wondered if statistics about population movement would correlate with linguistic diversity, as measured by the Greenberg Diversity Index (GDI) for a country (see below).  However, this is a cautionary tale about obsession and use of statistics.  (See bottom of post for  link to data).

Continue reading “Linguistic diversity and traffic accidents”

Cultural Evolution and the Impending Singularity

Prof. Alfred Hubler is an actual mad professor who is a danger to life as we know it.  In a talk this evening he went from ball bearings in castor oil to hyper-advanced machine intelligence and from some bits of string to the boundary conditions of the universe.  Hubler suggests that he is building a hyper-intelligent computer.  However, will hyper-intelligent machines actually give us a better scientific understanding of the universe, or will they just spend their time playing Tetris?

Let him take you on a journey…

Continue reading “Cultural Evolution and the Impending Singularity”

Bayesian phylogenetic analysis of Japonic languages

Lee & Hasegawa (2011) use phylogenetic methods to trace the origins of Japonic languages and dialects.  Two hypotheses are considered:  First, the farming/language dispersal hypothesis posits that the main factor for the divergence of genetic and linguistic diversity was agricultural expansion.  Second, the diffusion/transformation hypothesis posits that cultural innovations such as farming can diffuse between societies, and so genetic and linguistic diversity should not be linked.  The estimate of the common linguistic ancestor was in accordance with the farming/language dispersal hypothesis, again suggesting that that linguistic diversity followed genetic diversity.

The study is notable in considering dialects as well as languages and using etymology dictionaries to reconstruct forms from Middle and Old Japanese.  The analysis is also done with their own reconstructions and another, unrelated set.  The technique is similar to that used by Russel Gray et al. (2009) to study Pacific settlement patterns.

Lee S, & Hasegawa T (2011). Bayesian phylogenetic analysis supports an agricultural origin of Japonic languages. Proceedings. Biological sciences / The Royal Society PMID: 21543358

Gray, R., Drummond, A., & Greenhill, S. (2009). Language Phylogenies Reveal Expansion Pulses and Pauses in Pacific Settlement Science, 323 (5913), 479-483 DOI: 10.1126/science.1166858

How old am I?

It’s my birthday!  But how old am I?  Well, that’s not such a straightforward question.  Even a seemingly well-defined concept such as age can be affected by cultural factors

First, my age in years is a bit of an estimate of the actual amount of time I’ve been alive, due to leap-years etc.  Second, a year is a culturally determined (although not all that arbitrary) amount of time.  But these are petty squabbles.

There are bigger differences.  For instance, there are cultural differences when it comes to the recall of birth dates.  And I’m not talking about saying you’re 24 when you’re 68.  Matched comparisons of age reporting in death certificates and census data found minimal differences for white Americans (Hill et al., 2000) but nearly half were inconsistent for African-Americans (Hill et al., 1997). These may be due to economic differences.

Furthermore, the definition of age can vary cross-culturally.  Knodel & Chyovan (1991) surveyed women between the ages of 15 and 49 in Thailand.  As well as finding that up to 20% reported an age that was more than one year different to their actual age, they surmised that most calculated their age as difference between the present year and the year of their birth, disregarding whether their birthday had passed.


So in some parts of the world I’ve been 26 for four months now, or was it 25?


Hill, M., Preston, S., Elo, I., & Rosenwaike, I. (1997). Age-Linked Institutions and Age Reporting among Older African Americans Social Forces, 75 (3) DOI: 10.2307/2580528

Hill, M., Preston, S., & Rosenwaike, I. (2000). Age Reporting among White Americans Aged 85+: Results of a Record Linkage Study Demography, 37 (2) DOI: 10.2307/2648119

Knodel J, & Chayovan N (1991). Age and birth date reporting in Thailand. Asian and Pacific population forum / East-West Population Institute, East-West Center, 5 (2-3) PMID: 12343437

Colour terms and national flags

I’m currently writing an article on the relationship between language and social features of the speakers who use it. As studies such as Lupyan & Dale (2010) have discovered, language structure is partially determined by social structure.  However, it’s also probable that many social features of a community are determined by its language.

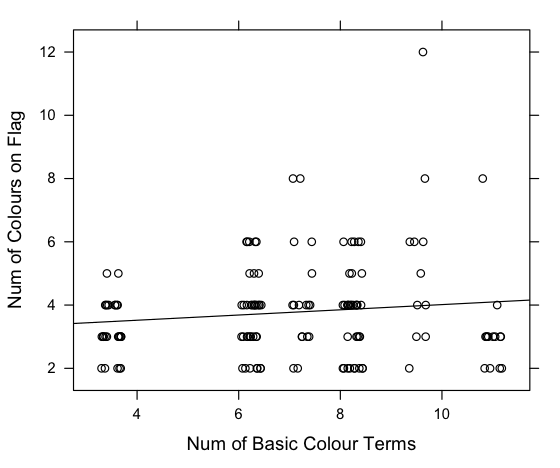
Today, I wondered whether the number of basic colour terms a language has is reflected in the number of colours on its country’s flag. The idea being that a country’s flag contains colours that are important to its society, and therefore a country with more social tools for discussing colour (colour words) will be more likely to put more colours on its flag. It was a long shot, but here’s what I found:

The World Atlas of Language Structures has data on the number of basic colours in many languages (Kay & Maffi, 2008). Wikipedia has a list of country flags by the number of colours in them.  Languages with large populations (like English, Spanish etc.) were excluded.  It’s known that the number of basic colour terms correlates with latitude, so a partial correlation was carried out.  There was a small but significant relationship between the number of colour terms in a langauge and the number of colours on the flag where that language is spoken (r = 0.15, τ = 254, p=0.01, partial correlation, 2-tailed using Kendall’s tau).

Here’s the flag of Belize, where Garífuna is spoken (9-10 colours in the language, 12 colours on the flag):

Here is the flag of Nigeria where Ejagham is spoken (3-4 colours in the langauge, 2 colours on the flag):

Interestingly, the languages with the highest number of colours in their language and flag come from Central America while the majority of the languages with the lowest number of colours in their language and flag come from Africa.  Maybe there’s some cultural influence on neighbouring flags.

Update:

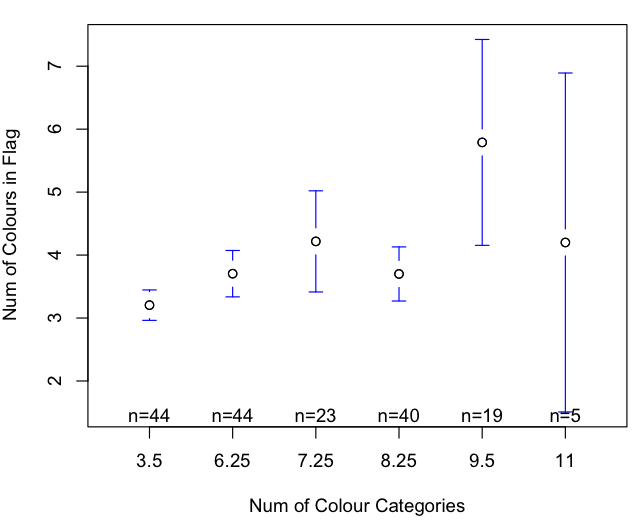
Here’s a boxplot, which makes more sense:

Also, I re-ran the analysis taking into account distance from the equator, speaker population and some properties of the nearest neighbour of each language (number of colours on flag and number of basic colours in langauge).  A multiple regression showed that the number of basic colours in a language is still a significant predictor of the number of colours in its national flag (r = 0.12, F(106,16)=1.8577, p= 0.03).  This analysis was done by removing languages with populations more than 2 standard deviations from the mean (9 languages out of 140).  The relationship is still significant with the whole dataset.

There are still problems with this analysis, of course.  For example, many of the languages in the data are minority languages which may have little impact on the national identity of a country.  Furthermore, the statistics may be compromised by multiple comparisons, since there may be a single flag for more than one language.  Also, a proper measure of the influence of surrounding languages would be better.  The nearest neighbour was supposed to be an approximation, but could be improved.

Lupyan G, & Dale R (2010). Language structure is partly determined by social structure. PloS one, 5 (1) PMID: 20098492

Kay, Paul & Maffi, Luisa. (2008). Number of Basic Colour Categories.In: Haspelmath, Martin & Dryer, Matthew S. & Gil, David & Comrie, Bernard (eds.) The World Atlas of Language Structures Online. Munich: Max Planck Digital Library, chapter 133.

Prairie Dog Communication

istockphoto.comA recent NPR radio show covered the research of the biosemiotician Con Slobodchikoff of the Univeristy of Arizone on prairie dog calls. The piece is very public-orientated, but still might be worth listening to.

ResearchBlogging.orgWe’ve all (I hope) heard of the vervet monkeys, which have different alarm calls for different predators, such as for leopard (Panthera pardus), martial eagle (Polemaetus bellicosus), and python (Python sebae). (Seyfarth et al. 1980) For each of these predators, an inherent and unlearned call is uttered by the first spectator, after which the vervet  monkeys respond in a suitable manner – climb a tree, seek shelter, etc. It appears, however, that prairie dogs have a similar system, and that it is a bit more complicated.

Slobodchikoff conducted a study where three girls (probably underpaid, underprivaleged, and underappreciated (under)graduate students) walked through a prairie dog colony wearing shirts of the colors green, yellow, and blue. The call of the first prairie dog to notice them was recorded, after which the prairie dogs all fled into their burrows. The intern then walked through the entire colony, took a break for ten minutes, changed shirts, and did it again.

What is interesting is that the prairie dogs have significantly different calls (important, as they are pretty much exactly the same to human ears) for blue and yellow, but not for yellow and green. This is due to the dichromatic nature of praire dog eyesight (for a full study of the eyesight of retinal photoreceptors of subterranean rodents, consult Schleich et al. 2010). The distinction between blue and yellow is important, however, as there isn’t necessarily any reason that blue people are any more dangerous to praire dogs than yellow ones. “This in turn suggests that the prairie dogs are labeling the predators according to some cognitive category, rather than merely providing instructions on how to escape from a particular predator or responding to the urgency of a predator attack.” (Slobodchikoff 2009, pp. 438)

Another study was then done where two towers were built and a line was strung between them. When cut out shapes were slung down the line, the prairie dogs were able to distinguish a triangle from a circle, but not a circle from a square. So, the prairie dogs are not entirely perfect at encoding information. The conclusion still stands however that more information is encoded in the calls than is entirely relevant to a suitable reaction (unless one were to argue that evolutionary pressure existed on prairie dogs to distinguish blue predators from yellow ones.)

NPR labels this ‘prairiedogese’, which makes me shiver and reminds me of Punxatawney Pennsylvania, where Bill Murray was stuck on a vicious cycle in the movie Groundhog Day, forced every day to watch the mayor recite the translated proclamation of the Groundhog, which of course spoke in ‘groundhogese’. Luckily, however, there won’t be courses in this ‘language’.

References:

Schleich, C., Vielma, A., Glösmann, M., Palacios, A., & Peichl, L. (2010). Retinal photoreceptors of two subterranean tuco-tuco species (Rodentia, Ctenomys): Morphology, topography, and spectral sensitivity The Journal of Comparative Neurology, 518 (19), 4001-4015 DOI: 10.1002/cne.22440

Seyfarth, R., Cheney, D., & Marler, P. (1980). Monkey responses to three different alarm calls: evidence of predator classification and semantic communication Science, 210 (4471), 801-803 DOI: 10.1126/science.7433999

Slobodchikoff CN, Paseka A, & Verdolin JL (2009). Prairie dog alarm calls encode labels about predator colors. Animal cognition, 12 (3), 435-9 PMID: 19116730
Phoneme Inventory Size and Demography

It’s long since been established that demography drives evolutionary processes (see Hawks, 2008 for a good overview). Similar attempts are also being made to describe cultural (Shennan, 2000; Henrich, 2004; Richerson & Boyd, 2009) and linguistic (Nettle, 1999a; Wichmann & Homan, 2009; Vogt, 2009) processes by considering the effects of population size and other demographic variables. Even though these ideas are hardly new, until recently, there was a ceiling as to the amount of resources one person could draw upon. In linguistics, this paucity of data is being remedied through the implementation of large-scale projects, such as WALS, Ethnologue and UPSID, that bring together a vast body of linguistic fieldwork from around the world. Providing a solid direction for how this might be utilised is a recent study by Lupyan & Dale (2010). Here, the authors compare the structural properties of more than 2000 languages with three demographic variables: a language’s speaker population, its geographic spread and the number of linguistic neighbours. The salient point being that certain differences in structural features correspond to the underlying demographic conditions.

With that said, a few months ago I found myself wondering about a particular feature, the phoneme inventory size, and its potential relationship to underlying demographic conditions of a speech community. What piqued my interest was that two languages I retain a passing interest in, Kayardild and Pirahã, both contain small phonological inventories and have small speaker communities. The question being: is their a correlation between the population size of a language and its number of phonemes? Despite work suggesting at such a relationship (e.g. Trudgill, 2004), there is little in the way of empirical evidence to support such claims. Hay & Bauer (2007) perhaps represent the most comprehensive attempt at an investigation: reporting a statistical correlation between the number of speakers of a language and its phoneme inventory size.

In it, the authors provide some evidence for the claim that the more speakers a language has, the larger its phoneme inventory. Without going into the sub-divisions of vowels (e.g. separating monophthongs, extra monophtongs and diphthongs) and consonants (e.g. obstruents), as it would extend the post by about 1000 words, the vowel inventory and consonant inventory are both correlated with population size (also ruling out that language families are driving the results). As they note:

That vowel inventory and consonant inventory are both correlated with population size is quite remarkable. This is especially so because consonant inventory and vowel inventory do not correlate with one another at all in this data-set (rho=.01, p=.86). Maddieson (2005) also reports that there is no correlation between vowel and consonant inventory size in his sample of 559 languages. Despite the fact that there is no link between vowel inventory and consonant inventory size, both are significantly correlated with the size of the population of speakers.

Using their paper as a springboard, I decided to look at how other demographic factors might influence the size of the phoneme inventory, namely: population density and the degree of social interconnectedness.

Continue reading “Phoneme Inventory Size and Demography”

Evolution of Colour Terms: 1 Genetic Constraints

Continuing my series on the Evolution of Colour terms, this post reviews the evidence for genetic constrains on colour perception. For the full dissertation and for references, go here.

Continue reading “Evolution of Colour Terms: 1 Genetic Constraints”

Evolution of Colour Terms: Part 1

In a series of posts, I’ll review the current state of the field of the Evolution of Colour Categories.  It has been argued that universals in colour naming across cultures can be traced back to constraints from many domains including genetic, perceptual and environmental.    I’ll review these arguments and show that if our perception is affected by our language, then many conflicts can be resolved.  Furthermore, it undermines the Universalist assumption that universal patterns in colour terms are evidence for innate constraints.

Part 1: Domains of Constraint

Genetic Constraints

Environmental Constraints

Perceptual Constraints

Learning Constraints

Cultural Constraints

Categorisation Constraints

Part 2: Universal patterns are not evidence for innate constraints

Perceptual Warping

Embodied Relationships

Niche Construction

Universal Patterns are not Evidence for Innate Constraints

For the full dissertation and for references, go here.

Continue reading “Evolution of Colour Terms: Part 1”