Spurious correlation bonanza to mark Replicated Typo 2.0 reaching 100,000 hits

Replicated Typo 2.0 has reached 100,000 hits!  The most popular search term that leads visitors here is ‘What makes humans unique?’ and part of the answer has to be our ability to transmit our culture.  But as we’ve shown on this blog, culturally transmitted features can be highly correlated with each other.  This fact is a source of both frustration and fascination, so I’ve roped together some of my favourite investigations of cultural correlations into a correlation super-chain.  In addition, there’s a whole new spurious correlation at the end of the article!

Edit: You can hear me talk about these correlations in an extended EU:Sci podcast.

Let Replicated Typo take you on trip from acacia trees to traffic accidents…

Continue reading “Spurious correlation bonanza to mark Replicated Typo 2.0 reaching 100,000 hits”

Language Evolves in R, not Python: An apology

One of the risks of blogging is that you can fire off ideas into the public domain while you’re still excited about them and haven’t really tested them all that well.  Last month I blogged about a random walk model of linguistic complexity (the current post won’t make much sense unless you’ve read the original).  Essentially, it was trying to find a baseline for the expected correlation between a population’s size and a measure of linguistic complexity.  It assumed that the rate of change in the linguistic measure was linked to population size.  Somewhat surprisingly, correlations between the two measures (similar to the kind described in Lupyan & Dale, 2010) emerged, despite there being no directional link.

However, these observations were made on the basis of a relatively small sample size.  In order to discover why the model was behaving like this, I needed to run a lot more tests.  The model was running slowly in python, so I transliterated it to R.  When I did, the results were very different: In the first model an inverse relationship between the population size and the rate of change of linguistic complexity yielded a negative correlation between population size and linguistic complexity (perhaps explaining results such as Lupyan & Dale’s).  However in the R model this did not occur.  In fact, significant correlations only appeared 5% of the time, with that 5% being split exactly between positive and negative correlations.  That is, the baseline model has a standard confidence interval, not the much stricter one I had suggested in the last post.

Why was this happening?  In short:  Rounding errors and small sample sizes.

I checked the Python code, but couldn’t find a bug, so the correlations really were appearing, and really were favouring a negative correlation.  Here’s my best explanation:  First, the sample of runs was too low to capture the proper distribution.  However, strong correlations were appearing.  This could be because although the linguistic complexity measure started out pretty randomly distributed, the individual communities were synchronising at the maximum and minimum of the range as they bumped up against it.  This caused temporary clusters in the low ranges where the linguistic complexity was changing rapidly (and therefore more likely to synchronise), creating tied ranks in the corners.  In addition to this, the Python script I was using had a lower bit depth for its numbers than R, so was more prone to rounding errors.  I have to assume as well that my Python script somehow favoured numbers closer to 1 than to 0.  It’s still not a very satisfactory explanation, but the conclusion remains that, as one would expect, affecting just the rate of change of linguistic complexity does not produce correlations.

Modelling evolutionary systems often runs into these kinds of problems:  The search spaces are often intractable for some approaches.  Also I am not, as a mere linguist, aware of some of the more advanced computational techniques.  It’s one of the reasons that Evolutionary Linguistics requires a pluralist approach and tools from many different disciplines.

It’s embarrassing to have to correct previous statements, but I guess that’s what Science is about.  In the blogging age ideas can get out before they’re fully tested and potentially affect other work.  This has its advantages – good ideas can get out faster.  But it also means that the reader must be more critical in order to catch poor ideas like the one I’m correcting here.

Sorry, Science.

Here’s a link to the R script (25 lines of code!).

Lupyan G, & Dale R (2010). Language structure is partly determined by social structure. PloS one, 5 (1) PMID: 20098492

Sonority and Sex: Why smaller communities are louder

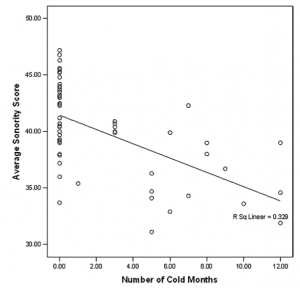
This post was chosen as an Editor's Selection for ResearchBlogging.orgThrough this post on Sprogmuseet about Atkinson’s analysis of the out of Africa hypothesis, I found an article by Ember & Ember (2007) (who also quantified the link between colour lexicon size and distance from the equator, see my post here) on Sonority and climate.  The article extends work by Fought et al. (2004) which finds that a language’s sonority is related to climate.  Sonority is a measure of amplitude (loudness) as is greater for vowels than for consonants (for example, see here).  Basically, the warmer the climate, the greater the sonority of the phoneme inventory of the population.  The theory is that “people in warmer climates generally spend more time outdoors and communicate at a distance more often than people in colder climates”.

Continue reading “Sonority and Sex: Why smaller communities are louder”

A random walk model of linguistic complexity

EDIT: Since writing this post, I have discovered a major flaw with the conclusion which is described here.

One of the problems with large-scale statistical analyses of linguistic typologies is the temporal resolution of the data.  Because we only typically have single measurements for populations, we can’t see the dynamics of the system.  A correlation between two variables that exists now may be an accident of more complex dynamics.  For instance, Lupyan & Dale (2010) find a statistically significant correlation between a linguistic population’s size and its morphological complexity.  One hypothesis is that the language of larger populations are adapting to adult learners as they comes into contact with other languages.  Hay & Bauer (2007) also link demography with phonemic diversity.  However, it’s not clear how robust these relationships are over time, because of a lack of data on these variables in the past.

To test this, a benchmark is needed.  One method is to use careful statistical controls, such as controlling for the area that the language is spoken in, the density of the population etc.  However, these data also tend to be synchronic.  Another method is to compare the results against the predictions of a simple model.  Here, I propose a simple model based on a dynamic where cultural variants in small populations change more rapidly than those in large populations.  This models the stochastic nature of small samples (see the introduction of Atkinson, 2011 for a brief review of this idea).  This model tests whether chaotic dynamics lead to periods of apparent correlation between variables.  Source code for this model is available at the bottom.

Continue reading “A random walk model of linguistic complexity”

Linguistic Structure: the Result of L2 Learners?

Wray and Grace (2007) propose that the structure of a language is dependent of the social structure of the population who speak it. Lupyan & Dale (2010) later showed this using statistical analysis. This has been discussed extensively on this blog before:

http://www.replicatedtypo.com/science/language-as-a-complex-adaptive-system/422/

http://www.replicatedtypo.com/uncategorized/memory-social-structure-and-language-why-siestas-affect-morphological-complexity/2382/

One of the proposed reasons for why large population size is thought to affect linguistic structure is that larger populations will have a larger ratio of second language (L2) speakers to first language (L1) speakers.

Languages within exoteric niches (large population and geographical spread with many language neighbors) have been shown to be more more morphologically isolating and, as a result, regular. This has proposed to be because of the biases of adult second language learners.

Esoteric languages are more irregular and morphologically complex and idiosyncratic. This is thought to be because of the biases of child learners.

There are studies which show that adult learners have a tendency to regularise languages but only under some circumstances. Hudson Kam & Newport (2009) show that adult learners will regularise unpredictable variability but only if it exists above a certain level of scatter and complexity.

As for the learning biases of children, Wray & Grace (2007) cite only one study which looked at children who were ‘native’ speakers of Esperanto (Bergen, 2001). Bergen (2001) found that the language that the children learnt displayed a loss of the accusative case and also displayed attrition in the tense system. Although Wray & Grace (2007) suggest that this explains patterns seen in esoteric communities, it may not be as straight forward as they suggest. The evidence suggests that esoteric conditions are going to display more morphological strategies in their languages which is the opposite to the biases the child learners of Esperanto are displaying. The children are rejecting morphological strategies in favour of attrition and word order.

I wanted to point out in this post that there is evidence to suggest that adult learners preserve irregularities and idiosyncrasies, while children learners regularize (suggesting the opposite to Wray & Grace).

Studies which have addressed these problems include Hudson Kam & Newport (2005) where adult learners of an artificial language preserved unpredictable variation and child learners of the same language regularized it. Hudson Kam & Newport (2009) show in a similar study that child learners of an artificial language will regularise unpredictable irregularity but, as mentioned above, adult learners will only do this where the irregularity passes a certain level of complexity.

However, some evidence does support Wray & Grace’s (2007) proposal about adult learners.  Smith & Wonnacott (2010) show that despite there being a tendency within individual adult learners to maintain the level of unpredicted variability within the language learning process, when put into a diffusion chain of adult learners the language regularises.  Smith & Wonnacott (2010) suggest that gradual processes such as this can explain the regularisation of languages over time. While this fits nicely with Wray & Grace’s (2007) theory there is still the problem that children are just as liable to regularise as adults if not more so.


This is just some relevant experiments which I thought lent something to the debate. I know there are other factors which have been proposed to have an effect on linguistic structure. I was just curious about people’s opinions on quite to what level L2 speakers have an effect.

The Return of the Phoneme Inventories

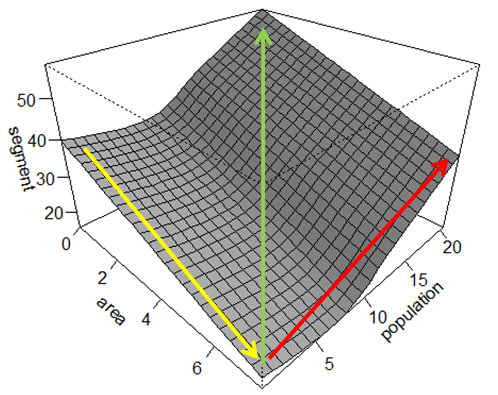
Right, I already referred to Atkinson’s paper in a previous post, and much of the work he’s presented is essentially part of a potential PhD project I’m hoping to do. Much of this stems back to last summer, where I mentioned how the phoneme inventory size correlates with certain demographic features, such as population size and population density. Using the the UPSID data I generated a generalised additive model to demonstrate how area and population size interact in determining the phoneme inventory size:

Interestingly, Atkinson seems to derive much of his thinking, at least in his choice of demographic variables, from work into the transmission of cultural artefacts (see here and here). For me, there are clear uses for these demographic models in testing hypotheses for linguistic transmission and change, as I see language as a cultural product. It appears Atkinson reached the same conclusion. Where we depart, however, is in our overall explanations of the data. My major problem with the claim is theoretical: he hasn’t ruled out other historical-evolutionary explanations for these patterns.

Before we get into the bulk of my criticism, I’ll provide a very brief overview of the paper.

Continue reading “The Return of the Phoneme Inventories”

Colour terms and national flags

I’m currently writing an article on the relationship between language and social features of the speakers who use it. As studies such as Lupyan & Dale (2010) have discovered, language structure is partially determined by social structure.  However, it’s also probable that many social features of a community are determined by its language.

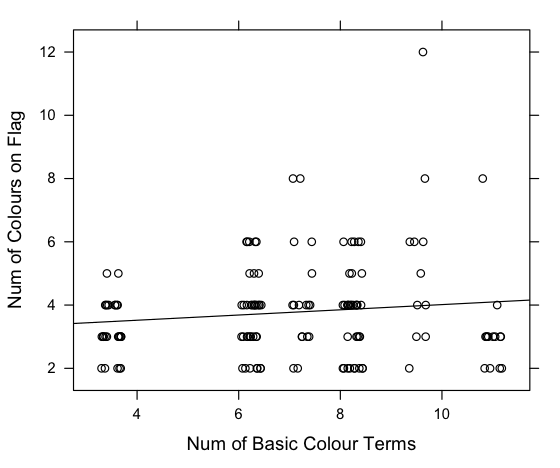
Today, I wondered whether the number of basic colour terms a language has is reflected in the number of colours on its country’s flag. The idea being that a country’s flag contains colours that are important to its society, and therefore a country with more social tools for discussing colour (colour words) will be more likely to put more colours on its flag. It was a long shot, but here’s what I found:

The World Atlas of Language Structures has data on the number of basic colours in many languages (Kay & Maffi, 2008). Wikipedia has a list of country flags by the number of colours in them.  Languages with large populations (like English, Spanish etc.) were excluded.  It’s known that the number of basic colour terms correlates with latitude, so a partial correlation was carried out.  There was a small but significant relationship between the number of colour terms in a langauge and the number of colours on the flag where that language is spoken (r = 0.15, τ = 254, p=0.01, partial correlation, 2-tailed using Kendall’s tau).
Here’s the flag of Belize, where Garífuna is spoken (9-10 colours in the language, 12 colours on the flag):

Here is the flag of Nigeria where Ejagham is spoken (3-4 colours in the langauge, 2 colours on the flag):

Interestingly, the languages with the highest number of colours in their language and flag come from Central America while the majority of the languages with the lowest number of colours in their language and flag come from Africa.  Maybe there’s some cultural influence on neighbouring flags.

Update:

Here’s a boxplot, which makes more sense:
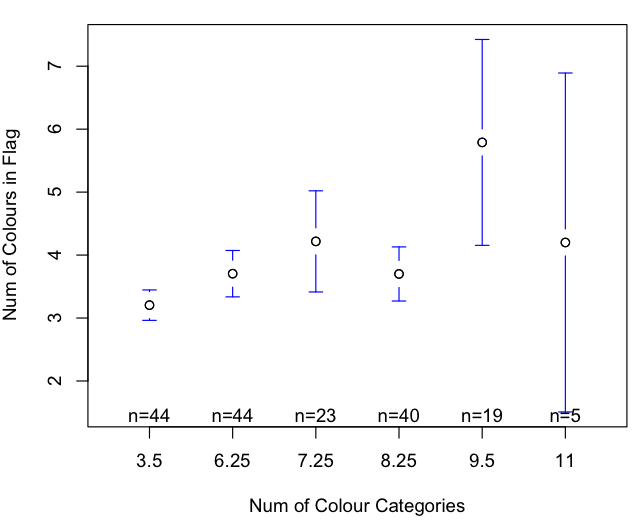
Also, I re-ran the analysis taking into account distance from the equator, speaker population and some properties of the nearest neighbour of each language (number of colours on flag and number of basic colours in langauge).  A multiple regression showed that the number of basic colours in a language is still a significant predictor of the number of colours in its national flag (r = 0.12, F(106,16)=1.8577, p= 0.03).  This analysis was done by removing languages with populations more than 2 standard deviations from the mean (9 languages out of 140).  The relationship is still significant with the whole dataset.

There are still problems with this analysis, of course.  For example, many of the languages in the data are minority languages which may have little impact on the national identity of a country.  Furthermore, the statistics may be compromised by multiple comparisons, since there may be a single flag for more than one language.  Also, a proper measure of the influence of surrounding languages would be better.  The nearest neighbour was supposed to be an approximation, but could be improved.

Lupyan G, & Dale R (2010). Language structure is partly determined by social structure. PloS one, 5 (1) PMID: 20098492

Kay, Paul & Maffi, Luisa. (2008). Number of Basic Colour Categories.In: Haspelmath, Martin & Dryer, Matthew S. & Gil, David & Comrie, Bernard (eds.) The World Atlas of Language Structures Online. Munich: Max Planck Digital Library, chapter 133.
Memory, Social Structure and Language: Why Siestas affect Morphological Complexity

Children are better than adults at learning second languages.  Children find it easy, can do it implicitly and achieve a native-like competence.  However, as we get older we find learning a new language difficult, we need explicit teaching and find some aspects difficult to master such as grammar and pronunciation.  What is the reason for this?  The foremost theories suggest it is linked to memory constraints (Paradis, 2004; Ullman, 2005).  Children find it easy to incorporate knowledge into procedural memory – memory that encodes procedures and motor skills and has been linked to grammar, morphology and pronunciation.  Procedural memory atrophies in adults, but they develop good declarative memory – memory that stores facts and is used for retrieving lexical items.  This seems to explain the difference between adults and children in second language learning.  However, this is a proximate explanation.  What about the ultimate explanation about why languages are like this?

Continue reading “Memory, Social Structure and Language: Why Siestas affect Morphological Complexity”

Phoneme Inventory Size and Demography

It’s long since been established that demography drives evolutionary processes (see Hawks, 2008 for a good overview). Similar attempts are also being made to describe cultural (Shennan, 2000; Henrich, 2004; Richerson & Boyd, 2009) and linguistic (Nettle, 1999a; Wichmann & Homan, 2009; Vogt, 2009) processes by considering the effects of population size and other demographic variables. Even though these ideas are hardly new, until recently, there was a ceiling as to the amount of resources one person could draw upon. In linguistics, this paucity of data is being remedied through the implementation of large-scale projects, such as WALS, Ethnologue and UPSID, that bring together a vast body of linguistic fieldwork from around the world. Providing a solid direction for how this might be utilised is a recent study by Lupyan & Dale (2010). Here, the authors compare the structural properties of more than 2000 languages with three demographic variables: a language’s speaker population, its geographic spread and the number of linguistic neighbours. The salient point being that certain differences in structural features correspond to the underlying demographic conditions.

With that said, a few months ago I found myself wondering about a particular feature, the phoneme inventory size, and its potential relationship to underlying demographic conditions of a speech community. What piqued my interest was that two languages I retain a passing interest in, Kayardild and Pirahã, both contain small phonological inventories and have small speaker communities. The question being: is their a correlation between the population size of a language and its number of phonemes? Despite work suggesting at such a relationship (e.g. Trudgill, 2004), there is little in the way of empirical evidence to support such claims. Hay & Bauer (2007) perhaps represent the most comprehensive attempt at an investigation: reporting a statistical correlation between the number of speakers of a language and its phoneme inventory size.

In it, the authors provide some evidence for the claim that the more speakers a language has, the larger its phoneme inventory. Without going into the sub-divisions of vowels (e.g. separating monophthongs, extra monophtongs and diphthongs) and consonants (e.g. obstruents), as it would extend the post by about 1000 words, the vowel inventory and consonant inventory are both correlated with population size (also ruling out that language families are driving the results). As they note:

That vowel inventory and consonant inventory are both correlated with population size is quite remarkable. This is especially so because consonant inventory and vowel inventory do not correlate with one another at all in this data-set (rho=.01, p=.86). Maddieson (2005) also reports that there is no correlation between vowel and consonant inventory size in his sample of 559 languages. Despite the fact that there is no link between vowel inventory and consonant inventory size, both are significantly correlated with the size of the population of speakers.

Using their paper as a springboard, I decided to look at how other demographic factors might influence the size of the phoneme inventory, namely: population density and the degree of social interconnectedness.

Continue reading “Phoneme Inventory Size and Demography”

Evolution of Colour Terms: 4 Learning Constraints

Continuing my series on the Evolution of Colour terms, this post reviews how learning constrains colour naming. For the full dissertation and for references, go here.

Continue reading “Evolution of Colour Terms: 4 Learning Constraints”